CONGRATULATIONS! YOU FOUND THE EASTER EGG

RESEARCH
Digging deep to design smart.
I'm a UX Researcher with experience across nonprofits, academia, and startups.
From building VR frameworks that strengthen cultural connections, to co-designing learning dashboards that support transfer students, my work spans mixed-method studies, accessibility, and social innovation.
8+
Research Papers
3000+
Downloads
3
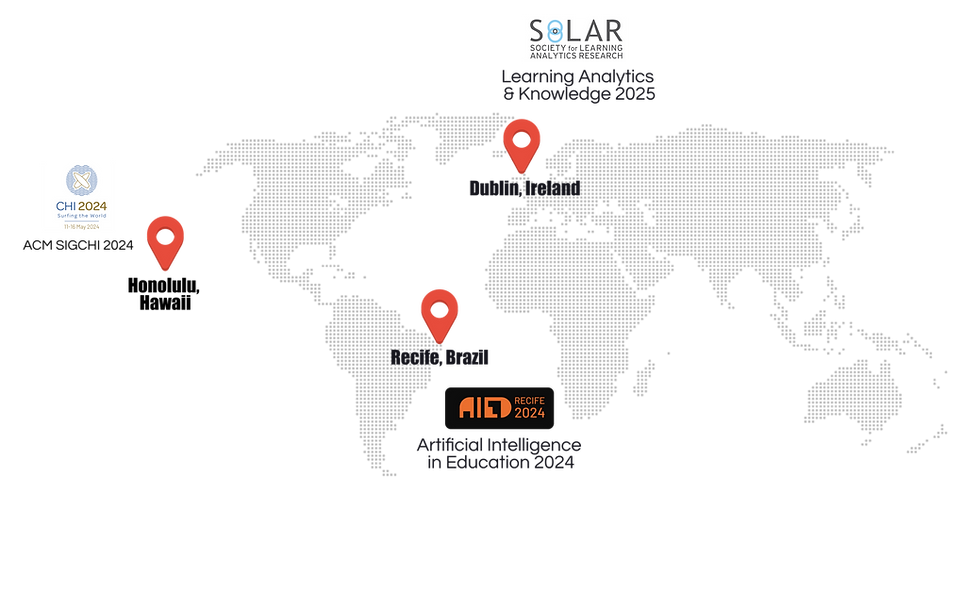
Conferences
PUBLICATION MAP
RESEARCH METHODS

Qualitative Methods
Relevant Papers:
Quantiative Methods

Relevant Papers:
🔰Co-design studies for Self Reflection Coming Soon
1/ PeerConnect: Co-Designing a Peer-Mentoring Support System with Computing Transfer Students
Authors: Prachee Javiya, Nisha Anthraper, Sai Illuru, Karen Chen, Andrea Kleinsmith
This study contributes to HCI and CSCW work in designing support systems for mentoring and peer support programs in educational settings and to the emerging literature on student-centered learning analytics systems.

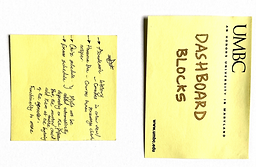
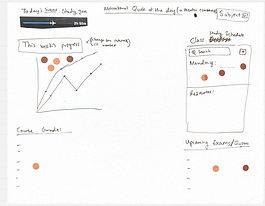
Initial wireframe LAD concepts made my UX Researchers
Workshop Artifacts
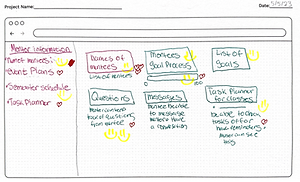

Visualization creation, Think-pair-share, affinity mapping,
user interviews, dot-voting


Design Iterations after Data Analysis
3 Minute Presentation
2/ Comparing Levels of Social Anxiety in VR vs in-person
Authors: Prachee Javiya, Tara Urso
This paper explores the emotional responses of individuals with moderate social anxiety in both in-person and virtual reality (VR) settings to determine VR's efficacy as a therapeutic tool. With the increasing prevalence of social anxiety, particularly post-COVID-19 due to heightened social isolation, innovative interventions are necessary. Utilizing a mixed-methods approach, we compared physiological responses in a VR environment. This research contributes to understanding VR's role in managing social anxiety and proposes directions for future research to enhance the realism and therapeutic potential of VR experiences.
.png)
Participant filling LSAS Survey
Observation room
Participant POV - VR interaction
Participant wearing VR Headset
Qualitative Data
Audio recordings
Observation Notes
Interview responses
VR Video castings
Quantitative Data
Survey
LSAS Scores
Heart Rate
Temperature
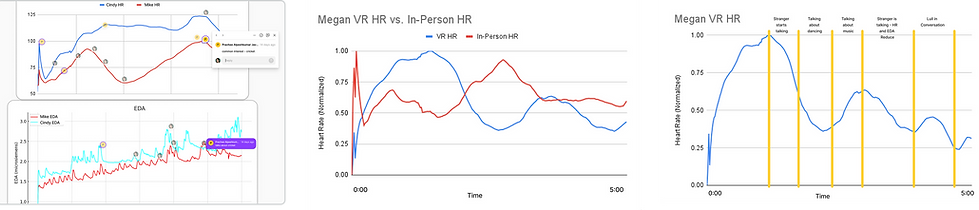
Used FigJam to align to timeline and annotate topics while analyzing audio and non-verbal notes.
Compared each participant’s in-person and VR physiological data.
Examined physiological data in relation to specific topics of conversation during each session, visually segmenting the data by these thematic windows

This snapshot captures some of my favorite moments blending research, community, and play.

Have an idea?
Let's Talk.
San Jose, CA


Made with by Prachee